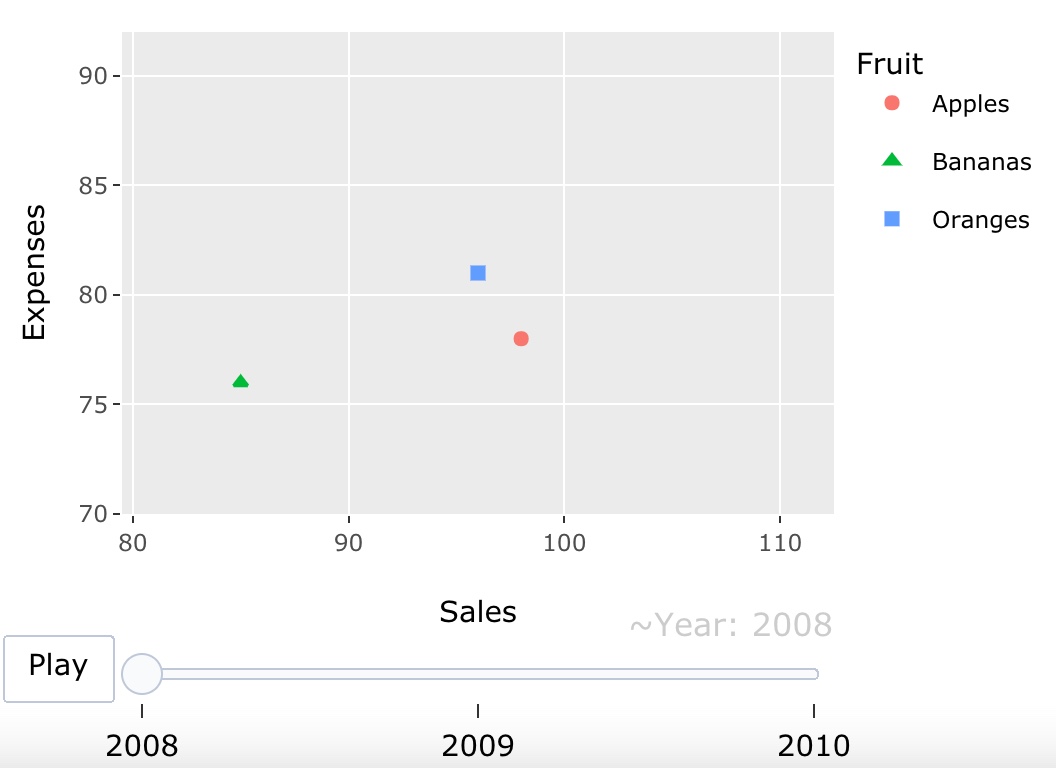
Motion chart
library(ggplot2, plotly)
data(Fruits)
p<-ggplot(Fruits, aes(Sales, Expenses, shape=Fruit, col=Fruit))+geom_point(aes(frame=Year)) # frame for ggplotly
ggplotly(p)

Multiple Trace Animation
library(plotly, ggplot2)
library(gapminder) # dataset
p<-ggplot(gapminder, aes(gdpPercap, lifeExp, color=continent))+geom_point(aes(size=pop, frame=year, ids=country))+scale_x_log10()
ggplotly(p)

Add Button Options
animation_opts(p, frame=500, transition=frame, easing=“linear”, redraw=TRUE, mode=“immediate”)
animation_slider(p, hide=FALSE, …)
animation_button(p, …, label)
p: plotly object
frame: amount fo the smooth transition between frames(in milliseconds)
transition: duration of the smooth transition between frames
easing: the type of transition easing
redraw: Trigger a redraw of the plot at completion of the transition
mode: Describes how a new animate call interacts with currently-running animations
(Immediate, next, afterall)
hide: remove tha animation slider
label: character string used for the animation button
library(ggplot2, plotly)
library(gapminder)
p<-ggplot(gapminder, aes(gdpPercap, lifeExp, col=continent))+geom_point(aes(size=pop, frame=year, ids=country))+scale_x_log10()
fig<-ggplotly(p)
fig<-fig %>%
animation_opts(
1000, easing="elastic", redraw=FALSE
)
fig<-fig %>%
animation_button(
x=1, xanchor="right", y=0, yanchor="bottom"
)
fig
%>% operator는 함수의 특정 인수를 넣을 때 사용된다.(파이프 연산자)
Add Slider Options
library(ggplot2, plotly)
library(gapminder)
p<-ggplot(gapminder, aes(gdpPercap, lifeExp, col=continent))+geom_point(aes(size=pop, frame=year, ids=country))+scale_x_log10()
fig<ggplotly(p)
fig<-fig %>%
animation_opts(
1000, easing="elastic", redraw=FALSE
)
fig<-fig %>%
animation_button(
x=1, xanchor="right", y=0, yanchor="bottom"
)
fig<- fig %>%
animation_slider(
currentvalue=list(prefix="YEAR", font=list(color="red"))
)
fig